
September 15, 2020
Sanctions by the Numbers: Spotlight on Iran
The June edition of “Sanctions by the Numbers” illustrated a decade of U.S. sanctions policy by using heat maps to show the countries with the largest number of designations. Across both the Trump and Obama administrations, Iran was always at the top of the list. This edition of Sanctions by the Numbers explores Iran sanctions further, tracking how designations and delistings have evolved over time, the dozens of countries affected by Iran-related sanctions programs, and the top types of U.S. designations. The data add to the existing consensus that sanctions have an inverse relationship with Iran’s economic health, and designations have far outpaced delistings in the last three years as part of the Trump administration’s “maximum pressure” campaign.

Designations by type of entity, plotted against real GDP growth, 2009–2020 (projected). (Sources: U.S. Department of the Treasury Office of Foreign Assets Control, International Monetary Fund)
This graph represents overall designations under Iran-related programs* from January 2009 to July 2020 on the left axis, and the percent of annual real GDP growth on the right axis. The line graph represents real GDP growth, with negative values for GDP contraction. A clear inverse relationship exists between the two; GDP contracts as designations increase. Growth reached a peak of 12.5 percent in 2016, shortly after the Joint Comprehensive Plan of Action (JCPOA), also known as the Iran Deal, went into effect and the United States delisted more than 700 targets. Two years of significant GDP contractions occurred after the United States reimposed these sanctions in 2018. GDP contracted by 5.4 percent in 2018 and 7.6 percent in 2019. The continued contraction in 2019 is likely due to the lasting effects of 2018 listings, especially on Iran’s oil and gas exports. Growth levels are unlikely to match the 2016 peak if maximum pressure continues.

Delistings by type of entity, plotted against real GDP growth, 2009–2020 (projected). (Sources: U.S. Department of the Treasury Office of Foreign Assets Control, International Monetary Fund)
The link between delistings and GDP growth is less clear. Delistings were negligible compared to designations in every year except 2016, after the JCPOA went into effect. GDP did increase in 2016, so high volumes of delistings may lead to increases in GDP, but this one-year spike is too unusual to produce generalizable conclusions. GDP appears to be more strongly related to designations, while delistings may only affect GDP at scale. Furthermore, there were no delistings of any kind from 2017 to 2019, and only eight entities have been delisted in 2020, all connected to the delisting of Cosco Dalian, a major Chinese shipping company sanctioned in September 2019, in January. Overall, sanctions on the oil and gas sector historically have had the greatest impact on GDP. A full, sector-specific examination of sanctions and economic data over the range of 2009 to 2020 is beyond the scope of this analysis.
A growing preference for sanctions on individuals

Designations in 2009–2016

Designations in 2019–2020
As the first graphic, showing designations by entity type relative to real GDP growth, and these charts show, the United States has sanctioned a higher proportion of individuals relative to other entity types (businesses and groups, vessels, and aircraft) in the past two years. On average, individuals represented just 18 percent of designations during the Obama administration, a low share that could be due to the wave of Mahan Air sanctions on aircraft in 2012 or the difficulty in revealing the beneficial owners behind illicit entities. Entities such as businesses, armed groups, and organizations still occupy the highest share of designations, but in 2019 and 2020, individuals have represented an average of 43 percent of designations. Most individuals listed in the past two years are affiliated with the Islamic Revolutionary Guard Corps or the Central Bank of Iran.
The global reach of Iran sanctions programs

Designations Under Iran-related Authorities Outside of Iran, 2009–2020
Sanctions related to Iran affect far more countries than just Iran. This map illustrates the countries with the greatest number of sanctioned individuals and entities under Iran-related sanctions programs. The darkest red countries, including the United Arab Emirates, China, Germany, and Syria, are also major trade partners with Iran. Beyond these top countries for Iran-related designations, other countries to which Iran-related sanctions are linked include the United States, South Africa, India, Turkey, and the United Kingdom.
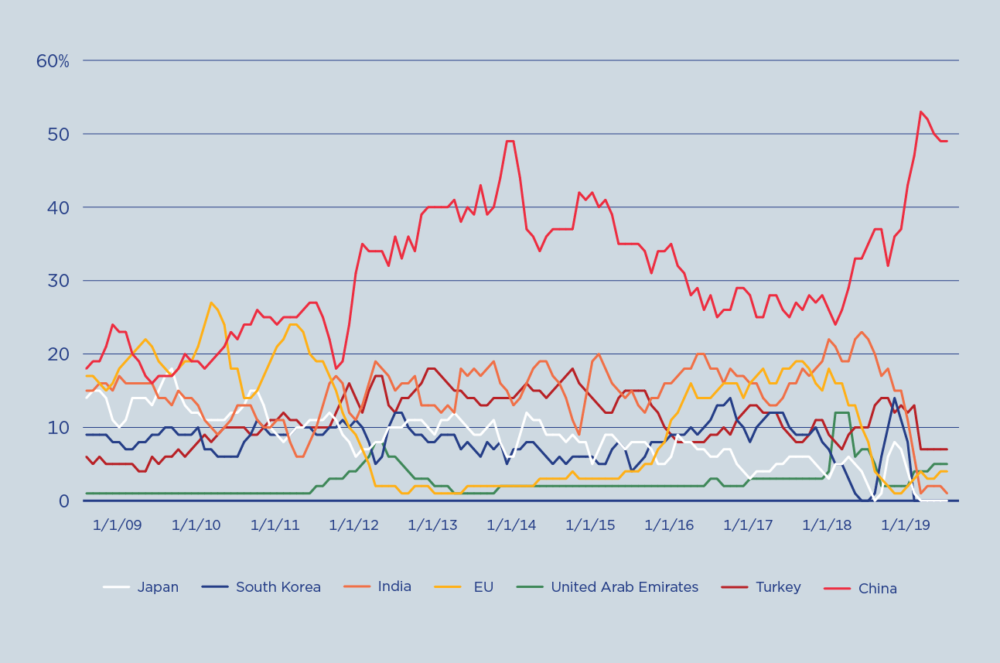
Major trading partners, percentage share of Iran’s overall exports. (Source: International Monetary Fund Direction of Trade statistics)
Methodology
*The following sanctions programs were included: CAATSA-IRAN, FSE-IR, HRIT-IR, IFCA, IFSR, IRAN, IRAN-EO13622, IRAN-EO13645, IRAN-EO13846, IRAN-EO13876, IRAN-EO13871, IRAN-EO13902, IRAN-HR, IRAN-TRA, IRGC, ISA, NS-ISA, TCO, SDNT, SDNTK, NPWMD, and IRAQ3. TCO, SDNT, SDNTK, NPWMD, and IRAQ3 sanctions were only included when the designee either originated in, or is closely affiliated with, Iran. For example, Mehdi Group is listed under SDGT and located in India, but is affiliated with the Iranian oil trade.
This is the third installment in the Sanctions by the Numbers series. To read the first installment by Johnpatrick Imperiale, click here. To read the second installment by Abigail Eineman, click here.
Learn More
The CNAS Sanctions by the Numbers series offers comprehensive analysis and graphical visualization of major patterns, changes, and developments in U.S. sanctions policy and economic statecraft. Members of the CNAS Energy, Economics, and Security Program collect and analyze data from publicly available government sources, such as the Treasury Department’s Office of Foreign Assets Control.

Sanctions by the Numbers
About this series The Sanctions by the Numbers newsletter and series offers comprehensive analysis and visualization of major patterns, changes, and developments in U.S. sanct...
Read More- “OFAC Recent Actions,” U.S. Department of the Treasury Office of Foreign Assets Control, https://www.treasury.gov/resource-center/sanctions/OFAC-Enforcement/Pages/OFAC-Recent-Actions.aspx. ↩
- “Islamic Republic of Iran,” International Monetary Fund, https://www.imf.org/en/Countries/IRN. ↩
- “Islamic Republic of Iran,” International Monetary Fund Direction of Trade Statistics, https://data.imf.org/?sk=9D6028D4-F14A-464C-A2F2-59B2CD424B85&sId=1515619375491. ↩
Author
-
Abigail Eineman
Former Intern, Energy, Economics, and Security Program
Abigail Eineman is a former Joseph S. Nye, Jr. Intern for the Energy, Economics, & Security Program at the Center for a New American Security (CNAS)....

More from CNAS
-
Sanctions by the Numbers: U.S. Sanctions Designations and Delistings, 2009–2019
Reports
The United States uses financial sanctions as a prominent tool of foreign policy. While this tool is used with increasing frequency and popularity, there is relatively limited...
By Johnpatrick Imperiale
-
Sanctions by the Numbers: The Geographic Distribution of U.S. Sanctions
Reports
In February, CNAS launched Sanctions by the Numbers, a project to track U.S. sanctions designations and delistings. In this second installment, heat maps show the most heavily...
By Abigail Eineman
-
Sanctions by the Numbers: 2024 Year in Review
Reports
Washington’s economic statecraft has expanded in recent years, largely in response to Russia’s war in Ukraine, competition with the People’s Republic of China...
By Eleanor Hume & Kyle Rutter
-
Sanctions by the Numbers: Comparing the Trump and Biden Administrations’ Sanctions and Export Controls on China
Reports
Executive Summary The Biden administration has exceeded the Trump administration in the number of financial sanctions and entity-based export controls placed on Chinese person...
By Eleanor Hume & Rowan Scarpino


